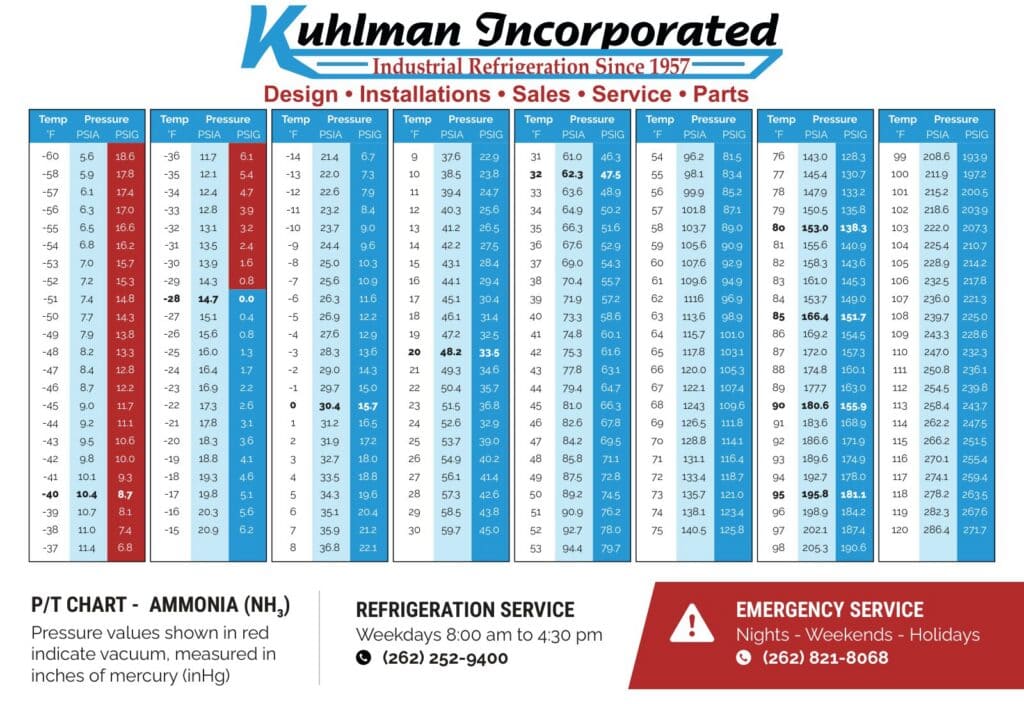
If you work around an industrial ammonia refrigeration system, one of the most useful reference tools you can have is an ammonia pressure-temperature chart, commonly called a P-T chart.
At its core, a P-T chart answers one simple question:
At a given pressure, what is the saturation temperature of ammonia?
Or, working in the opposite direction:
At a given saturation temperature, what pressure should ammonia be at?
That relationship is fundamental to understanding what is happening throughout an ammonia refrigeration system. A P-T chart can be used to convert pressure to saturation temperature, identify saturated conditions, calculate superheat or subcooling, and help determine whether the conditions you are seeing in the field make sense.
The important thing to remember is that a P-T chart represents saturation conditions. It is not a chart of every possible temperature ammonia can exist at.
Understanding the Ammonia P-T Chart
A P-T chart shows the relationship between pressure and saturation temperature for ammonia. For every saturation pressure, there is a corresponding saturation temperature. If you know one, the chart allows you to find the other.
Pressure values shown in red indicate vacuum, measured in inches of mercury (inHg). Positive pressures are shown in psig.
When Does the P-T Relationship Apply?
The most important thing to understand when using a P-T chart is when the pressure-temperature relationship applies.
A simple rule to remember is:
Anywhere liquid ammonia and ammonia vapor exist together, the refrigerant is at saturation.
At saturation, pressure and temperature are directly related. If you know the pressure, the P-T chart tells you the saturation temperature. If you know the saturation temperature, the chart tells you the corresponding pressure.
In an industrial ammonia system, common examples where liquid and vapor may exist together include:
- Evaporators, where liquid ammonia boils as it absorbs heat
- Wet suction or wet return piping, carrying a mixture of liquid and vapor
- Recirculator vessels, where liquid and vapor ammonia are separated
- Thermosiphon receivers, which contain saturated liquid and vapor
- Condensers, where ammonia vapor condenses back into liquid
- Other vessels or piping containing both liquid and vapor ammonia
For example, if a wet return line is operating at 20 psig, the P-T chart shows the corresponding saturation temperature. Whether that two-phase ammonia is in an evaporator, wet return line, recirculator, or condenser, the same P-T relationship applies.
What If Only Vapor or Liquid Is Present?
If ammonia is entirely vapor or entirely liquid, pressure alone does not necessarily tell you its actual temperature.
A common example is downstream of a DX evaporator. Once all of the liquid ammonia has boiled off, additional heat raises the temperature of the ammonia vapor above its saturation temperature. The vapor is now superheated.
You can use the P-T chart to determine the saturation temperature at the measured pressure and compare it with the actual measured temperature. The difference is the amount of superheat.
The same principle applies to liquid ammonia. If the actual liquid temperature is below the saturation temperature corresponding to its pressure, the liquid is subcooled.
So even when the refrigerant is not saturated, the P-T chart gives you the reference point needed to understand its condition.
Using a P-T Chart for Troubleshooting
One of the most useful applications of a P-T chart is checking whether the pressure and temperature you are seeing make sense for where you are in the system.
If you expect liquid and vapor ammonia to be present together, the measured pressure and temperature should correspond closely to the saturation relationship shown on the P-T chart.
If they do not line up, something may not be operating the way you expect.
For example, suppose you are checking a wet return line where you expect both liquid and vapor to be present. You measure the pressure, use the P-T chart to determine the saturation temperature, and find that the actual pipe temperature is significantly warmer.
That discrepancy tells you to investigate further. Possible causes could include:
- An obstruction or restriction in the piping, resulting in a pressure difference between measurement locations
- An uninsulated or damaged section of piping, allowing enough heat into the line for the remaining liquid ammonia to boil off
- Insufficient liquid feed, resulting in vapor-only flow where you expected a liquid-vapor mixture
- An inaccurate pressure or temperature measurement
- A pressure drop between the locations where pressure and temperature are being measured
- Non-condensable gases, particularly when evaluating high-side conditions
The P-T chart does not tell you exactly which problem exists. Instead, it tells you that the measured conditions do not agree with the refrigerant condition you expected, giving you a starting point for troubleshooting.
The same concept can be used in reverse. If you expect superheated vapor downstream of a DX evaporator but the measured temperature remains very close to saturation, that may indicate that liquid ammonia is still present.
When Should You Use an Ammonia P-T Chart?
A P-T chart is useful anytime you want to understand what a pressure or temperature reading means in terms of the actual refrigerant condition.
Common uses include:
- Converting pressure to ammonia saturation temperature
- Converting saturation temperature to its corresponding pressure
- Determining the expected temperature where liquid and vapor ammonia are present together
- Calculating superheat downstream of a DX evaporator or in other vapor-only piping
- Calculating subcooling in liquid-only piping
- Checking whether measured pressure and temperature agree with the expected refrigerant condition
- Identifying unexpected phase changes, such as liquid boiling off before reaching the intended location
- Helping identify restrictions or unexpected pressure drops
- Evaluating possible non-condensables
- Checking whether pressure gauges, temperature sensors, and control readings are reasonable
This is what makes the P-T chart such a valuable field reference. It provides a known relationship that you can compare against what the system is actually doing.
What About Vacuum?
Low-temperature ammonia systems may operate below atmospheric pressure. In these conditions, pressure is commonly expressed as inches of mercury vacuum (inHg) rather than positive psig.
On the Kuhlman P-T chart, vacuum pressures are shown in red, while positive gauge pressures are shown in psig.
The chart is used the same way: find the measured pressure or vacuum and read the corresponding ammonia saturation temperature.
The Main Rule to Remember
Using an ammonia P-T chart does not need to be complicated:
If liquid and vapor ammonia are present together, pressure and saturation temperature are directly related.
If you have only vapor or only liquid, the chart still tells you the saturation temperature at that pressure, which can then be compared against the actual measured temperature.
And when the pressure, temperature, and expected refrigerant condition do not agree, the P-T chart can help tell you that something in the system deserves a closer look.
The P-T chart does not diagnose the system for you. It tells you what ammonia should be doing at a given pressure or saturation temperature. When the system does not match that expectation, you know where to start looking.
Download the Kuhlman Ammonia P-T Chart
Keep a copy of the Kuhlman Ammonia Pressure-Temperature Chart available as a quick reference for operation, service, and troubleshooting.